How accurate is the simulation?
This very simple model of the Earth is designed as an aid to learning rather than as a serious research tool. It makes a number of crude assumptions (e.g. that global temperatures are simply related to ice-sheet volumes) and the numbers that have been incorporated into the model are themselves the subject of much debate and ongoing research (you may well find different values in your textbooks for the initial sizes of the stores and the initial values of the various fluxes). One particularly important assumption of the model is that fluxes can change independently but, in reality, a change in climate will affect several fluxes (e.g. warming will increase evaporation from land, sea and ice simultaneously). You should therefore use this model only as an indicator of the kind of changes that can happen to the water-cycle rather than as a detailed predictor of those changes. It’s main purposes are to give you a clear understanding of what is meant by a store and what is meant by flux and help you understand how these interact. The model is also meant to make you think!
What are the take-home messages of the simulation?
By playing with this simulation, you should get a better feel for the following ideas:
- A store is an environment in which water is kept. For example, a great deal of water is stored in the oceans.
- A flux is a flow of water between stores. For example, water moves from the atmosphere and into the ocean as a consequence of rainfall.
- The behaviour of the water cycle can be approximate by “dynamic equilibrium”, i.e. a situation in which the total amount of water entering a store is balanced by the total amount of water leaving. As a result, the amount of water in the store does not change.
- If any one flux is altered, dynamic equilibrium is upset and all the fluxes and all the store-volumes change their values until a new equilibrium is found.

@rpnickson
Does the model include groundwater?
This model does not incorporate groundwater flow. This was done to keep the appearance uncluttered and because the changes to results would have been small. The groundwater store is large but the fluxes into and out of it are relatively small (that’s why groundwater has a long lifetime). As a consequence, the effect of these fluxes on the other stores is relatively unimportant. It should also be mentioned that the size of the groundwater fluxes are relatively poorly known.

What is δ18O?
δ18O measures how much heavy oxygen (i.e. 18O rather than 16O) is contained in the water held in the various stores. More specifically δ18O is the difference between the amount of 18O and the amount found in modern seawater (measured in parts per thousand where 1‰ = 0.1%).
Water molecules containing the heavier isotope of oxygen are harder to evaporate and so water in the atmosphere has less heavy oxygen than seawater (i.e. δ18O is negative). This effect is enhanced as the air moves towards the poles since heavier water is also more likely to fall out as rain on the way. The water that falls as snow onto ice-sheets is therefore very depleted in heavy oxygen and the amount of depletion is increased when Earth is cold as even more 18O then gets lost on the way.
The amount of water locked up as ice affects the amount of 18O in the seawater that’s left behind. This is because, as we’ve just seen, ice contains relatively more 16O and so, as ice builds up, the amount of lighter oxygen left behind in the sea starts to fall. Hence, δ18O is positive for seawater at times when there is more ice at the poles than we currently see.
Finally, 18O is also found in the calcium carbonate (i.e. CaCO3) that makes up the shells of sea creatures. The process of forming shells is slightly more efficient for 16O than 18O and so shells have slightly less 18O than the seawater they form in (i.e. the δ18O is more negative). This effect is enhanced by high seawater temperatures and so the difference between sea and shell is greater when it’s warm.
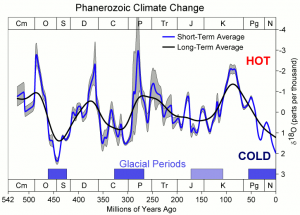
The final result of all this is that δ18O of ice-cores increases (i.e. becomes less negative) when temperatures rise whereas the δ18O of equatorial seawater (and shells) decreases as temperatures rise. You can see the effect on shells in the diagram above (NB the δ18O scale is reversed so that it becomes more negative upwards).
What is Exponential Decay?
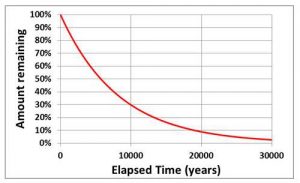
The best known example of exonential decay is probably the “half-life” of a radioactive element. For example, the half-life of Carbon-14 (the element used in radiocarbon dating) is 5730 years. This means that, after 5730 years, half of the Carbon-14 that was present has changed into Nitrogen-14. After a further 5730 years, half of the remaining Carbon-14 will then decay, and so on. Note that this means the rate of loss of Carbon-14 slows down with time in such a way that there is always some left (see figure).

The stores in the water cycle model behave in a similar way so that, if you change a flux, the volumes in the stores adjusts by “exponential decay” which means that they initially move rapidly towards the final equilibrium value but, as they approach it, the rate of change slows down. The lifetimes given in the water-cycle model are the times taken for about 2/3 of the change to occur and so these are slightly longer than “half-lives”. If you’re interested in knowing the half-lives, divide the lifetimes by 1.44 (e.g. a lifetime of 3000 years is equivalent to a half-life of 2079 years).
