What are the model assumptions?

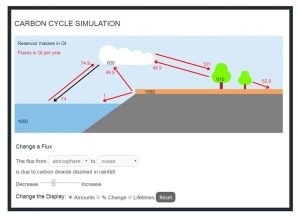
- A fixed fraction of the CO2 we’re putting into the atmosphere stays there. If you’re not sure why it doesn’t all just stay in the atmosphere, take a look at our Carbon Cycle simulation which shows that carbon is moved around between the different stores (atmosphere, oceans, soil and plants). As a result, if we add CO2 to the air, some of it will find its way into the other stores.
- The increase in temperature, produced by the CO2 in the air, can be amplified (or diminished) by feedback processes which enhance (or supress) the direct effect of CO2. In KISS this is modelled simply by multiplying the expected increase by a constant that you can change using the Climate sensitivity slider.
- Small, random fluctuations in climate occur from year to year. KISS models these simply by allowing you to predict a range of temperatures rather than a single temperature.
Where has the data come from?
 KISS uses three very different sources of data:
- Economic data which looks at the coal, oil and gas that has been extracted from 1751 right up until 2014. From this data we can estimate the amount of CO2 that should have been emitted by human activities in any particular year over that time period. The data itself can be found here.
- Direct measurements of atmospheric CO2 which have been taken continuously at Mauna Loa (Hawaii) since 1958. This data can be found here.
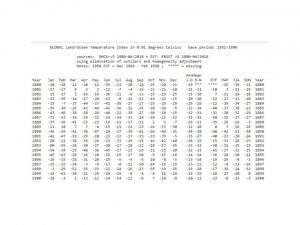
- Direct measurements of Earth’s temperature averaged over the surface and over a year. These measurements are particularly hard to obtain as the coverage over the Earth’s surface is very uneven and has changed through time. Nevertheless, estimates of the Earth’s average temperature from 1880 until 2017 can be found here.
What is “climate sensitivity”?

There is little scope for uncertainty in the predicted initial heating effect of carbon dioxide because this has been determined using highly accurate laboratory measurements. In fact, this direct heating effect is fairly small and, on its own, not large enough to be of serious concern. The uncertainties, and hence scope for debate, centre around the strength of feedback mechanisms.
The Earth’s average annual temperature can be changed by many factors: greenhouse gas levels; solar activity; volcanic eruptions; orbital cycles and many more. However, whatever primary factor causes a change in climate, this alteration will be enhanced or reduced by feedbacks in the climate system. For example, if the Earth warms a little, some ice melts in polar regions and the Earth becomes less reflective. This will enhance the initial warming as a less reflective Earth will absorb more solar heat. This is an example of a positive feedback because it increases the size of the initial effect. There are also negative feedbacks; processes that reduce the impact of an initial change in the climate system.
In KISS, feedback effects are modelled by supplying a number by which predicted temperature changes are multiplied. If the overall effect of all the feedback processes is positive then the multiplier is greater than one whilst, if the overall effect is a negative feedback, the multiplier will be less than one. Climate scientists use a slightly different measure of feedback which they call climate-sensitivity. This is usually given as the amount of warming produced by a doubling of CO2 (denoted T2x). The T2x value corresponding to a chosen feedback multiplier is shown by the KISS model to allow direct comparison. However, I prefer not to use T2x as relating feedback strength to CO2 doubling seems to imply that we’ve already assumed that CO2 is the climate-change culprit (actually, there isn’t really any such circular reasoning but some climate-change skeptics have been unnecessarily confused by this point).
KISS tests the hypothesis, that present-day climate change is driven primarily by changes in CO2, by allowing you to adjust the feedback strength until modelled global temperatures fit the observed temperatures. If you can get a good fit this supports the hypothesis whilst, if the fit is poor, the hypothesis should be rejected. So, play with the feedback strength to get the best fit you can. Does the climate system appear to have an overall positive feedback or an overall negative feedback? Is the fit close enough to convince you that rising CO2 (plus feedback) might explain the observed rise in temperatures? How does the climate sensitivity you obtain compare to that given by other people?
What does the CO2 Retained in Atmosphere slider do?
If the observed increase in carbon dioxide since 1958 is the result of human activities, there should be a simple relationship between the rate at which we pump it out and the rate at which it goes up. The CO2 concentration display allows you to compare the observed concentration to that predicted from the known output shown in the anthropogenic CO2 display.
The resulting prediction from KISS is not very good; the model clearly overestimates how much CO2 should have gone up since 1958. However, this assumed that all the CO2 released by humans has ended up in the atmosphere and this is unlikely to be correct. Some carbon dioxide will have been absorbed by the oceans and soil whilst some may also have been taken up by increased plant growth. So KISS allows you to see what would happen if less than 100% of the CO2 stays in the atmosphere.
Can you find a percentage that produces a good match between observations and data? Given the closeness (or not) of the resulting match; is the hypothesis, that the rise in CO2 results from human activities, supported in your view?
What is interannual variability?

Of course, climate change is not just the result of changes in greenhouse gasses. Mean annual temperatures are also affected by solar cycles, by ENSO (El-Nino Southern Oscillation), by volcanic eruptions and by many other effects. KISS includes these by simply assuming that they lead to random fluctuations in global mean temperature. The model therefore produces a range of possible temperatures in which the minimum predicted temperature in a given year differs from the maximum predicted temperature by the interannual-variability. Try a value of 1 °C to see what it does to the global mean temperature display. Then adjust the level until the observed temperatures more or less fit into the predicted range.
What is the peak CO2 production year slider for?
Once KISS has been calibrated, it can be used to predict the climate consequences of future CO2 production by humans. To avoid the most serious consequences of climate change, temperature increases should be kept below 2 ºC (i.e. the global average should stay below 16 ºC).
The scenarios investigated by KISS assume that CO2 production increases steadily from today’s value until a date specified by the user: the year of peak carbon dioxide production. The default value of 2030 is very optimistic. What happens if you replace it by a more realistic estimate of 2050? Do we still meet the targets of the Paris Climate Agreement? Can we give ourselves much more time by simply slowing the rate of increase for the next few decades?
What is the CO2 release rate?
KISS assumes that, up until the date set for peak CO2 production, the amount produced will go up by a fixed amount every year. The default value assumes that production continues to increase at the same rate that it did between 2000 and 2010 (i.e. an increase every year by an average of 0.88 Gt/year) but you can decrease this to simulate the effect of meaningful efforts to constrain outputs immediately or you can increase it to simulate the effect of rapid economic growth in a world which, for whatever reason, no longer feels the need for restraint.
What does Decay timescale mean?
The rate of anthropogenic CO2 production is assumed to decay after the year of peak CO2 production. This is specified in KISS by giving a half-life, i.e. the time taken for the production to fall by half. The default value of 35 years (together with the default peak year of 2030) therefore implies that humanity’s production of CO2 in 2065 will be half of the peak value in 2030. It then continues to fall by half every 35 years so that it will only be one quarter of the 2030 value by 2100. Adjusting this therefore models the effect of rapid, or less rapid, replacement of CO2 generating activities.
Correlation is not causation!
The KISS model only really shows:

- That the rise in atmospheric CO2 over the last 60 years is strongly correlated with the amount of CO2 that has been emitted by human activities.
- That the rise in temperatures over the last 150 years is strongly correlated with the rise in CO2 in our atmosphere.
Climate-change skeptics are fond of using the slogan “correlation is not causation” as a way of dismissing such facts but, in doing so, they are fundamentally misunderstanding scientific method. There is a genuine problem in that correlations cannot tell you what is cause and what is effect. But that’s not what we do in science. Instead we use a theory of cause and effect to predict correlations and then we look for those correlations as a way to support our theories. For example, simple physics predicts that the harder you throw a ball the further it will go and this can be tested by looking to see if throwing-distance is correlated with throwing-power. In exactly the same way we can predict that the more CO2 we put into the air, the higher the concentration of CO2 will be and then we can look for that correlation. Similarly, from our understanding of the heat-transmission properties of CO2, we can predict that the more of this there is in the atmosphere the higher will be the temperature. Then we can look for the correlation.