How is the modelling done?
My simulation is based upon a standard technique in epidemiology called the SIR model. This stands for Susceptible, Infected and Recovered. The population being modelled (here, the total population of the UK) is assumed to consist of people who have not yet been infected (the susceptible), people who are infected (and can infect others) and people who have recovered (and become immune as well as non-infectious). The rate at which people move from susceptible to infected—and from infected to recovered—depends upon factors such as how long the infection lasts, how many people you pass the disease onto and what proportion of the current population in infected or immune. If you’d like more detail you could do a lot worse than start with this Wikipedia page. There is also a more detailed and more technical description of my simulator at the bottom of these FAQs.
How is R0 related, in practice, to social distancing?
R0 (the average number of people infected by an infected individual if there is no immunity) is a useful way to characterise the effectiveness of social distancing. If it is effective then R0 will be less than one. However it is well beyond the scope of the model, used here, to calculate the effect on R0 of a particular social distancing policy. It would obviously be very helpful to know what the impact is of allowing schools to re-open (for example) but determining this is a very difficult problem and the subject of a great deal of on-going research.
What about vaccinations and treatments?

The model includes the effect of a treatment, introduced in June 2020, that resulted in a moderate drop in the fatality rate. You can see the effect of the timing and effectiveness of treatments by adjusting the values found on the Pharmacology tab. The potential effect of a vaccine is also included in the Pharmacology tab where you can adjust the date of introduction and the rate at which it is rolled out across the population.
Where has the data come from?
The default model is set up to compare predictions against UK data (NB it would be a simple matter to redo the model using data from other countries). The UK data has come from the UK government. The code to download the data from the government site and then put it into my simulation was written for me by my son (Charlie Waltham).
What does the Start tab do?
This tab allows the user to specify a number of parameters that relate to the starting conditions of the simulation.
- Population (millions) is, I hope, self evident. You would only change this if you wanted to use the model on a country other than the UK.
- Initial Date and Initial No of Cases: The simulation starts when the number of infections is small (but not zero). The number of infections on that start date need to be given. Note that identical results could be obtained by moving the date a little and adjusting the number of initial infections.
- Initial R0: You’ll see, in the Lockdown Intensity tab later, that you can vary R0 with time by specifying dates when it changes together with a new R0. However, the program needs an R0 value to use before the first date on which it changes.
What is the Rates tab for?
This tab allows the user to specify parameters that control how the total number of infected patients relate to the number who (sadly) die.
- Fatality rate: Simply the percentage of infected people who die from Covid-19.
- Report rate: One of the issues with modelling this pandemic is that (in the UK at least) the reported deaths are largely confined to deaths in hospital rather than in all settings. As a result, only a percentage of the actual deaths are being reported. This matters when, as with my model, the (unknown) total number of infected people is estimated from the deaths together with the death rate. To get around this issue, my program needs an estimate of the percentage of deaths that is actually being reported. N.B. from April 29th, the UK Government started reporting deaths in all settings instead of just in hospitals. My program now uses that, more complete, data but it is still likely that many deaths are being missed. Hence, I have increased the default reporting rate but not up to 100%.
Tell me about the Durations tab
- Simulation Length: Quite simply, the length of time that the model simulates. This can range from 20-800 days.
- Infection to recovery: Length of time that patients are in the infected category of the SIR model.
- Infection to death: For those patients who do not recover, this is the average time, after infection, before death occurs. This has a range associated with it that is controlled by a second slider.
How does the Lockdown Intensity tab control the modelled infection rates?
This tab simply allows the user to specify how R0 changes through time as a result of “non-pharmacological interventions” (NPIs) such as social distancing, the wearing of face masks or isolation of highly susceptible individuals. Values significantly greater than one will lead to rapidly increasing infection numbers (immediately) and fatalities (after a delay). Values smaller than one will lead to infections (and deaths) dropping eventually to zero. The two sliders for each row allow coarse changes (left slider) and more detailed changes (right slider).
What displays does the Plots tab allow?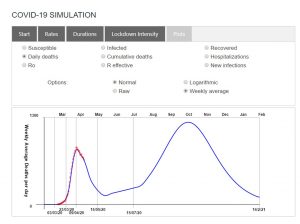
- Susceptible: The number of people who have not yet been infected.
- Infected: The number of people who are currently infected.
- Recovered: The number of people who have recovered and are now assumed to be immune.
- Daily deaths: The number of deaths reported and modelled on each day.
- Cumulative deaths: The total number of deaths reported and modelled since the start of the outbreak.
- Hospitalizations: The number of people reported and modelled to be occupying hospital beds as a result of Covid-19 infection.
- R0: Changes to R0 through time as a result of the user’s inputs to the Lockdown Intensity tab.
- R effective: The number of people infected, on average, by an infected individual is reduced as more of the population become immune. This display-choice illustrates how this effect modifies R0.
- New Infections: The number of people who are newly infected each day.
There are also options for how these results are displayed:
- Normal or Logarithmic. This is useful because exponential curves become straight lines in logarithmic plots.
- Raw or Weekly Average. The daily deaths data, in particular, is very scattered as a result of problems such as under-reporting at weekends. Showing the rolling average value over a week reduces this problem.
How is the modelling done (technical version)?
The model is based upon the nonstandard finite difference scheme of Arenas et al (2010) for solving the SIR differential equations. I have modified this scheme in the following minor ways:
- I have ignored births and non-Covid-related deaths. These are small corrections and there are already more model parameters than I would ideally like in a pedagogic software tool.
- I model Covid-related mortality by calculating the number of new infections each day and assuming that a fixed fraction of these lead to death after a (user-defined) range of delays.
- I model hospital bed usage by using the observed relationship between beds and deaths (Beds ∝ Deaths0.7).
- R0 is allowed to change through time (in response to non-pharmacological interventions).
- The effect of vaccines is included by changing susceptible individuals into recovered at a rate set by the vaccination rate (assumed to be given regardless of SIR state).
I should add that finite difference modelling of differential equations is what I have spent much of my 40 years in research doing. It’s just that I usually apply this method to geological rather than biological problems.